For O&M companies and solar portfolio owners

We find exactly which module, how urgent it is, what it costs you!

SolarIQ is a drone thermography platform for solar PV plants. It pinpoints every fault to the module, puts a euro figure on it and turns it into a work order for your crew. Your O&M budget follows the plant’s real condition.

99.3% fault detection accuracy report to IEC TS 62446-3 EU hosting, GDPR

SolarIQ app view with demo data: a map of the Polje Zapad plant with two blocks of module rows, an internal road and a fence, a thermal view on the right and an RGB view of the same rows on the left, with findings marked by type. The selected finding is a disconnected string in row 11 with an estimated loss of 1,860 euros per year, and an orange line leads to the same work order on the technician’s phone. A small card above the phone shows the estimated annual loss across three inspections.

App view with demo data: plant map with work orders by block, work orders sorted by value.

Platform

From capture to budget, layer by layer.

One inspection plus your plant design gives you five layers in the app: imagery, thermal map, design, work orders and budget.

The orange dot tracks one fault, a disconnected string in row 11, from the imagery through the design to a line in the budget. Crew, owner and investor all work from the same data, and every new inspection shows what has changed since the last.

Five SolarIQ app windows for the Polje Zapad plant stacked one above the other, from bottom to top: a map with the RGB capture, a map with the thermal capture, the plant’s digital design from CAD with module rows, strings and inverters, work orders for the South crew (string check in row 11, €1,860 per year, assigned, due 19 Nov; mowing along row 3, resolved) and the O&M budget for 2027: repairs €6,900, cleaning €2,600, inspections €2,100, total €11,600. The disconnected string in row 11 is marked on every layer (demo data).
  1. BudgetAn O&M budget based on actual condition, and trends over the years.
  2. Work ordersA fault becomes a work order with a crew and a due date; the technician closes it in the field.
  3. Plant designA digital design from CAD: the layout of modules, strings and inverters. Every fault is tied to its string and inverter.
  4. ThermogramEvery module located and classified; each fault has an exact place on the map.
  5. CaptureThermal and RGB capture of the whole plant in one inspection.

Shown with demo data.

Faults

Every finding has a name, a location and a consequence.

Thermal and RGB cameras capture every module. Each finding affects yield, safety on site or asset value.

Yield

Modules and strings that underperform but look fine from the outside.

Disconnected string

A whole string is producing nothing, yet looks exactly like its neighbours. The work order sends the crew straight to the right row, with no walking the field.

Left RGB, right thermal, same crop.
  • Bypass diode fault

    A third of the module is bypassed and produces nothing. The work order names the exact module, so nobody has to test the whole row.

  • Soiling

    Dust along the bottom edge and bird droppings shade the cells. Cleaning goes to the rows that need it, not the whole plant.

Safety

Overheating and damage that put the module, the plant and your crew at risk.

Hotspot

One cell runs hotter than its neighbours: the module loses power, and over time the overheating damages the glass and the backsheet. It is invisible to the eye, so without thermal imaging nobody knows where to look.

Left RGB, right thermal, same crop.
  • Hot junction box

    A poor connection in the junction box heats up under load. The crew arrives with a replacement box.

  • Vegetation by the modules

    Weeds growing over the edge shade the cells and, once dry, become a fire risk.

  • Damaged cable or frame

    Cables hanging into the grass get damaged by mowers and foot traffic, and a bent frame gives way under snow load. The work order includes a photo of the spot.

Warranty and asset value

Ageing and damage you need to prove module by module, for warranty claims, insurance, a sale or financing.

Cracked or broken glass

The crack is visible in RGB; the thermal image shows whether the cells underneath are damaged too. Moisture gets in through the crack, so insurers and warranty claims need evidence per module.

Left RGB with a module zoom, right thermal, same crop.
  • PID degradation

    Cells along the frame run hot first, on the modules at the end of the string. Every inspection is kept on record as evidence.

  • Missing or shifted module

    A broken string or loose mounting after a storm or theft.

Thermal crops and faults shown here are illustrations: the thermal image is derived from a real aerial photo and the fault is drawn in.

See real findings in the demo →
In the field

Send the crew to the module, not the whole plant.

The technician gets the module on a row map, its value and the due date, right on their phone. The O&M manager sees who is on what and what is done.

Life of a work order

  1. Open

    Raised from the latest inspection: a disconnected module in row 16, pinned on the map with an image crop.

  2. Assigned

    Assigned to the South crew, due by month end.

  3. Resolved in the field

    The technician checks the connectors or swaps the module, then closes it out on the phone.

  4. Confirmed

    The next inspection confirms the module is back online, and the work order is closed in the report.

Equipment

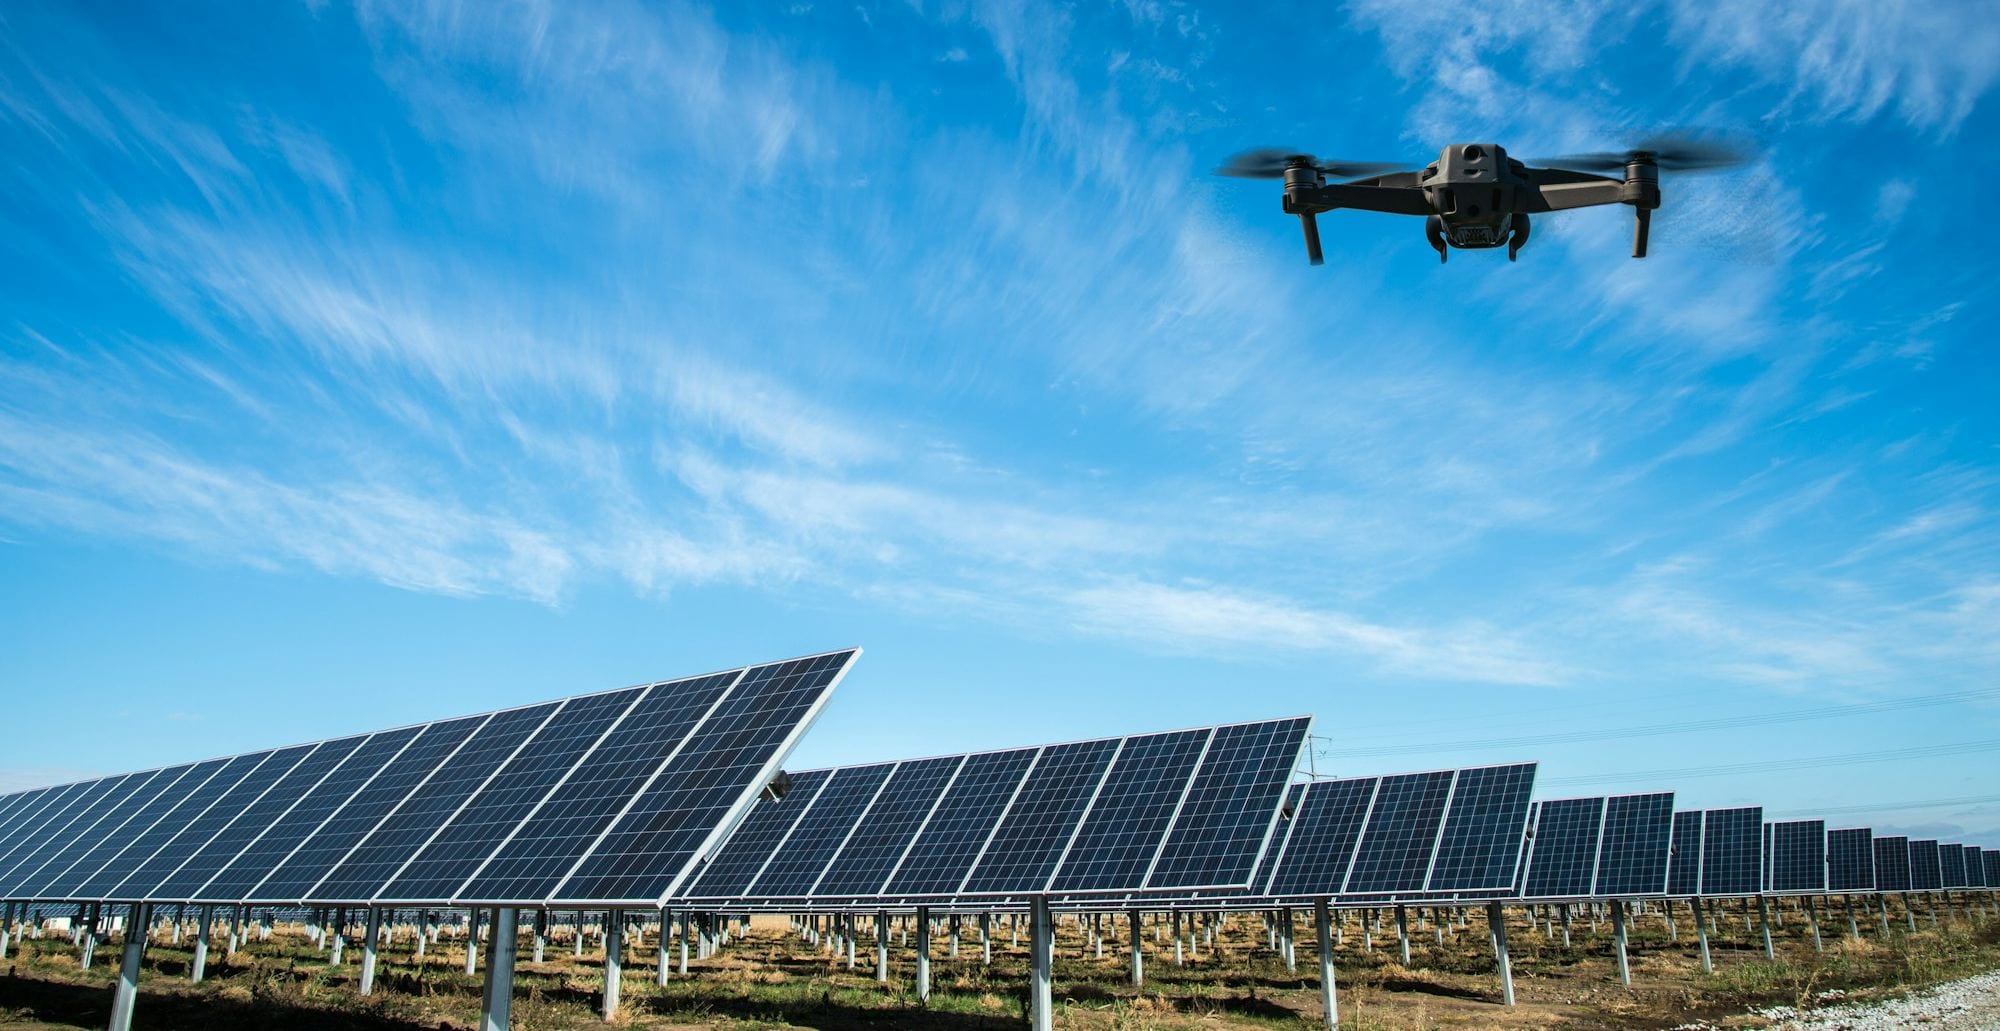
Flown by our team, your operator or a DJI Dock on site.

Whoever flies, the results in the platform are the same. We match the equipment and flight plan to your plant.

Capture

Drone with thermal and RGB cameras

A planned flight covers the whole plant while it keeps producing.

No production shutdown

In the field

Controller with the flight plan

The pilot monitors the flight plan and coverage while the drone captures, with no flying row by row by hand.

Full-plant flight plan

On site · optional

DJI Dock for automated flights

The drone takes off on site, on schedule. Images reach SolarIQ without manual uploads.

Regular flights, no crew on site

Capture conditions to IEC TS 62446‑3. We agree the flight date with you, based on the weather and the work schedule at the plant.

One report for the owner, the investor and the insurer.

Prepared to IEC TS 62446‑3, from the same data behind your crew’s work orders.

Executive summary
plant condition, number of findings and estimated loss in euros
Capture conditions
inspection scope and conditions on the day of the flight
Findings by module
location on the map, thermal and RGB capture
Work orders
recommendation and priority for each finding
Comparison
what has changed since the previous inspection
Export: PDFCSVREST API
Compared with manual inspection

Fast and complete from the air, instead of weeks walking every row.

Manual inspections take longer and find less. Your crew stops walking the rows and goes straight to the module, work order in hand.

99.3%
fault detection accuracymanual inspection: about 60%
1M+
modules analysed
5 million euros or more
in risks and savings identified
Manual inspection compared with inspection by SolarIQ
ComparisonManual inspectionSolarIQ
Inspection timeand method7+ daysper MWp, on foot row by row1 dayfrom the air, while the plant runs
What the team getsafter the inspectionnotes from the fielda work order with the module location, amount and due date
Who it’s for

One set of data for everyone who looks after the plant.

O&M crews see their work orders, owners see the portfolio and budget, and buyers and investors see the asset’s condition.

Field and maintenance

O&M companies

More MW per technician: crews go straight to the module that needs fixing.

  • A work order with the exact location, capture and due date on the phone
  • Scheduling by crew and due date
  • Open work orders and their value in one place
Portfolio and budget

Owners and asset managers

The whole portfolio on one screen, with condition and loss per plant.

  • Loss per plant and for the whole portfolio
  • An O&M budget based on actual condition, not on averages
  • Performance monitoring to IEC 61724‑1
Handover and warranty

EPC contractors

Fix findings before handover, not in a dispute afterwards.

  • Baseline inspection: every module imaged at commissioning
  • A punch list of findings, by module
  • A re-inspection of those modules before the warranty runs out
Acquisition, financing, insurance

Buyers, investors and due diligence

An independent view of the asset’s condition before you sign.

  • Condition and risk per module, not per sample
  • The report as an appendix to the deal documents
  • A basis for negotiating price and warranties

Interface snippets with demo data.

Integrations and security

Works with the systems you already use.

SolarIQ doesn’t replace your SCADA system or inverter portal. Work orders and instructions go where your team already works, and the data stays yours.

Security and dataIn brief, for an IT review before the pilot.

Hosting
in the EU, processing under GDPR
Encryption
in transit and at rest
Audit logs
who opened, changed or exported what
Availability
99.9% uptime
Standards
IEC TS 62446-3 (thermography) · IEC 61724-1 (performance monitoring)
  • SCADAProduction and alarms per plant, alongside findings from the field.
  • Inverter portalsHuawei FusionSolar, SMA, SolarEdge, Fronius.
  • DJI DockAutomated flights from the site, with no manual upload of captures.
  • REST API and exportFindings, work orders and reports into your internal and BI systems.

Interface snippets with demo data. We confirm the list of supported systems before the pilot.

At a glance

SolarIQ in six answers.

The key facts in one place, for you and your team.

What is SolarIQ?
A drone thermography platform for solar PV plants by Energize Intelligent Solutions. AI finds faults at module level, estimates the loss in euros and turns each one into a work order.
Who is it for?
O&M companies, plant owners and asset managers, EPC contractors, and buyers and investors in solar PV plants.
How long does an inspection take?
One day, from the air, while the plant keeps running. A manual inspection takes 7+ days per MWp.
How accurate is it?
99.3% fault detection accuracy, against about 60% for a manual inspection. More than a million modules analysed.
Which standards does it follow?
Reports to IEC TS 62446‑3, performance monitoring to IEC 61724‑1. EU hosting, GDPR-compliant processing.
What does it cost, and how do I start?
Pricing is per MWp, quoted after a short call. The first step is a pilot on one plant.
Plans

Pricing scales with MWp and how often you inspect.

We quote a price per MWp after a short call about your plants.

One-off

Per inspection

For a baseline inspection, a check before the warranty expires or due diligence.

  • Flight with thermal and RGB cameras
  • Faults per module with estimated loss
  • Report and data export
Price per MWp, on quoteRequest a quote
Every year

Platform, annual

For O&M teams running work orders all year round.

  • Inspections on your O&M schedule
  • Work orders and O&M budget
  • Trends over the years and REST API
Price per MWp per year, on quoteRequest a quote
Multiple plants

Tailored portfolio

For owners and asset managers with several sites and contractors.

  • One view of the whole portfolio
  • SCADA integration and your own KPIs
  • Reports for investors
Price per portfolio MWp, on quoteRequest a quote

The first step is a pilot at one site. At the end you receive the findings, work orders and a report for that plant, and we agree the measure of success in advance.

Arrange a pilot
Next step

Pick one plant. We’ll show you where the problems are.

In a short demo we walk you through the platform on a plant like yours, then agree a pilot.
  • A demo on data from a similar plant
  • An estimate for your plant in the demo
  • A pilot proposal with a measurable goal

Request a demo

A quick enquiry, no commitment.

I’m interested in

We use your details only for this enquiry. Privacy policy